
SLI home
User login

A BLOG FOR E-COMMERCE LEADERS

  • Blog
  • Resources
  • Webinars
  • Customer Experience Scorecard

SLI Blog

Posts in Reporting and Analytics Category

Retail Executive Brief: Customer Experience Trends for 2018

Posted by Bob AngusNovember 30, 2017Analytics, Artificial Intelligence, Customer Experience, E-commerce Research, eCommerce, Merchandising, Mobile, Mobile/Tablets, Personalization, Reporting and Analytics, User Experience

Customer Experience - Convert Buyers with a Great Customer Experience

The pressure is on for retail businesses to deliver on big sales growth expectations. That’s in the face of slow consumer spending growth combined with the tectonic shift in traditional retail channels.

You need to turn more shoppers into buyers. You can’t afford for your investment to bring more shoppers in the door or onto your e-commerce store that leave with an empty cart.

That’s why optimizing your customer experience is more important than ever.

This retail executive brief helps you better understand:

  • How customer experience strategies are evolving
  • What customer experience metrics to track and analyze
  • How to improve your customer experience using top trends in 2018

Let’s first dig into how customer experience is changing.

What is Customer Experience Today?

In the past, customer experience strategies focused on the discrete interactions shoppers had in the sales process. These touchpoints took on even greater importance with online retail channels simply because it was easier to track and optimize each webpage leading up to a sale.

However, this touchpoint-focused approach to improving customer experience can easily miss one critical element… the customer journey.

The journey is the customer experience.

The overall journey can still disappoint customers, even if your online store design, in-store layout and staffing are executed well on individual touchpoints.

Understand the customer journey in your shoppers’ terms. Customer journeys include many things that happen before, during, and after the actual purchase experience.

The journeys can be quite long, though the purchase decision can be extremely fast. Consider the multiple channels, devices, and, yes, direct interactions that may occur over days or even weeks.

Put yourself in their shoes. You buy products for yourself all the time. Think about your entire experience and why you made a purchase or didn’t.

Ask questions like:

  • Where and when did you first learn about a store?
  • What was your first impression of the brand?
  • What triggered you going in the store or to the website?
  • How easy was it to find what you wanted?
  • How did you feel about the product price and value? Product quality? Selection for you?
  • How did you feel about the shopping environment in-store or online?
  • What sales help, customer service or employee interactions did you have?
  • How did the purchase transaction go? Was it fast and easy?
  • How did you get your product? Was shipping fast? Did you need to exchange or return?

Always be asking how you can improve that journey.

Next you need to figure out if you’re on the right path to improvement.

Customer Experience Measurements for Success

How do you know you are improving your customer experience? You’ll want to look at the numbers.

It’s very tempting to dive right into the weeds. Retailers now have so many powerful analytics tools. And data collection is getting easier.

However, direct contribution to macro financial metrics and sales trends can be difficult. Remember, your customer experience is a holistic journey. So your best customer experience metrics are more macro. They are not necessarily analyzing and optimizing discrete touchpoints.

Start by measuring key customer experience outcomes, customer feedback, and employee feedback.

Financial Metrics

The most common outcome metrics are financial. Let’s assume you are already tracking total revenue, profit, and transaction volume. Great financial indicators of your customer experience is Revenue per Customer and Average Transaction Value.

Make sure to also track Revenue per Visit (RPV) for your online channel or if you are a pure e-commerce business. This metric estimates the incremental value of each visitor to your online store. Simply divide your total online revenue by the total number of unique visitors to your website.

Customer Satisfaction

You also need to measure your Net Promoter Score (NPS) to capture how customers feel about you. NPS is a fantastic customer satisfaction metric to track over time. Customer experience and customer satisfaction are closely correlated.

But the most actionable customer experience metric in your NPS comes from the answer to the follow-up question – “Why did you give that rating?”

Categorizing the results of this open-ended “Why” question helps you measure the impact on different factors in the customer journey in your customers’ terms. For example, you may group results by broad areas like customer service, products, or pricing. Or you can go more granular into the touchpoints like checkout experience, shipping, or return policies.

Learn more by further breaking down your NPS by customer segments. You can segment by geography, gender or age demographics, order revenue, or purchase frequency or recency.

Employee Satisfaction

Lastly, you should also measure your Employee NPS. Employee satisfaction is also highly correlated with customer experience. Happier employees lead to better customer experiences.

After all, your employees are most responsible for delivering a great customer experience. All your employees contribute. Even someone behind the scenes in HR, the warehouse, or web development have an impact that trickles into the experience.

Here again, look closely at the “why” to measure and track the drivers that influence your employees’ feelings. Those feelings result in behaviors and actions that directly and indirectly impact your customer experience. Listen to what they say and recommend.

Track these financial and satisfaction metrics consistently. That’s how you will know your customer experience is on the right path.They are your “North Star” numbers.

Once you’ve established those customer experience measurements, you can then go deeper into specific success metrics for operational improvement initiatives. Use Google Analytics and e-commerce platform results for your online channel.

Now let’s look at the latest trends you can leverage to boost your customer experience metrics and sales.

3 Technology Trends that Help You Improve Your Customer Experience in 2018

Retailers continue to leverage technology to improve customer experiences. Much of the change comes from consumer technology use as a pulling factor. For the first time ever, more people say they plan to shop online (59%) than in big box stores during the 2017 holiday season, according to the NRF.

Here are three technology trends that help brands connect better with customers and improve their overall customer experience.

1. Rapid Growth of Mobile Shopping
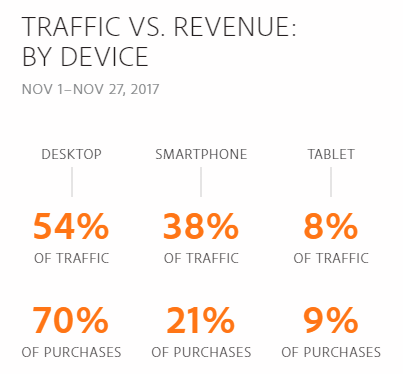
Mobile Traffic and Sales Statistics - Black Friday 2017 Cyber Monday 2017

The continued rapid growth of smartphone use is undeniably impacting retail sales. Similar to how e-commerce is the growth engine of overall retail, mobile sales are powering e-commerce.

The rising tide is driving much of that growth. Mobile traffic from smartphones and tablets peaked on Black Friday and Small Business Saturday (56% of traffic). Then leveled out to 46% of traffic, almost equivalent to desktop traffic (54%), through Cyber Monday 2017, according to Adobe Digital Insights.

However, the mobile shopping experience is a challenge for retailers. Smartphones and tablets earned a lower percentage of overall sales (30% versus 70% for desktop) and lower conversion rates through Cyber Monday.

Retailers can close more sales with mobile shoppers by continuing to improve their mobile customer experience. Shoppers now find mobile as an easy way to check emails (hopefully your emails), find store locations and hours, get product information, snap and share photos, and compare prices.

Optimizing mobile product discovery and mobile payments are the biggest opportunities for retailers to improve the mobile customer experience.

2. Personalized Merchandising with Artificial Intelligence

Customers want a personalized shopping experience. Sales people help shoppers in the store. Now application of artificial intelligence are helping online stores create a similar personal customer experience.

Online stores have massive amounts of behavioral and transactional data now. The challenge is to harness that data to power real-time merchandising decisions.

That’s where artificial intelligence excels.

Fifty-four percent of e-commerce sites have already implemented or plan to add AI in the future, according research from the Q3 2017 E-commerce Performance Indicators and Confidence Report. And 20% expect to add AI within the next 12 months.

The top application is personalized product recommendations. Eighteen percent of online retailers report they are already using artificial intelligence in their product recommendations strategies. But that number will swell dramatically in 2018 with 38% planning to implement within the next 12 months.
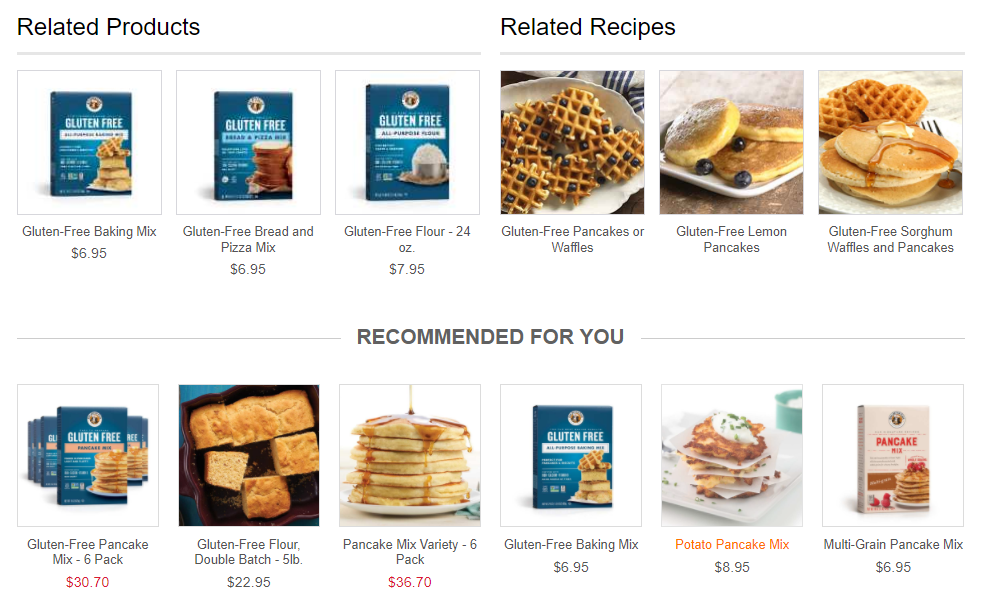
Personalized Product Recommendations Engine - King Arthur Flour

Artificial intelligence can parse user activity, preferences, and sales trends. The result is smart and timely product recommendations that are personal. For example, this type of contextual personalization can be tuned to gender, clothing size, brand preference, or shopper’s location.

Even better for online retailers, this personalization can be experienced by first-time visitors just as well as returning shoppers. So the shopper does not have to take any additional actions to receive the customer experience benefits.

3. Always on Customer Service with Chatbots

Chatbots were introduced as a new technology on the horizon for retailers in our 2017 e-commerce trend webinar. In 2018, chatbots are a must-have element of your online customer experience.

Ecommerce Chatbots - Retail live chat is always on

Think of chatbots like your online version of a sales associate or employee. Except they are always on 24/7/365.

A chatbot is an enhancement from the online chat communication channel. The old chat program still required a human sitting there typing in replies. Those employees had regular shifts. So sometimes customers weren’t getting their questions answered.

Now a chatbot is an always-on program that simulates the conversations your customers have with you. It answers questions, handles specific requests, helps shoppers choose the right product, and executes customer service procedures.

Your customer experience impact is shoppers have better and faster access to what they want when they want it. That’s a huge win. And you win more sales.

Customer adoption, and the resulting better experience and sales, is the biggest reason why chatbots are growing in e-commerce. Additionally two technology drivers are accelerating the deployment of chatbots – smartphones (again) and artificial intelligence (again).

Smartphone use is leading to speaking with a chatbot. Talking is easier than typing. Just say what you need and the chatbot tells you back. Siri, Alexa, and Google Assistant are all voice-enabled chatbots that are quickly growing is use.

Artificial intelligence is helping chatbots be more effective. The chatbot can repeat existing information easily and can be taught to mimic decision-making patterns. But artificial intelligence makes a difference by helping chatbots to actually learn. So your customer experience is continuously improving.

Design Your Customer Experience to Win More Sales

Planning and executing your customer experience strategies is a process of continuous improvement. Deeply understanding your customer’s journey sets you on the right path.

Take advantage of the key trends and technologies. Then test your innovations, measure, and optimize for the satisfaction of your customers and for the results that matter to you.

Ultimately, you can achieve what creative executive Loie Maxwell calls “designed serendipity”. Orchestrate the experiences that produce a customer journey that gives them a winning feeling. Your customers will love it. And you will win more sales.

Is Your Customer Experience Leaking Sales?

Most businesses are leaking online sales in at least 7 critical elements of their customer experience.

The Customer Experience Scorecard grades your e-commerce site using a 42-point checklist proven to increase sales, including:

  • Quickly finding products shoppers are most likely to buy
  • Personalized product recommendations
  • Mobile path to purchase

Want to find your leaks? Find out your quick-win opportunities to take your conversion rates to the next level.

A New Look at the Shopper Journey – Introducing the SLI Dashboard

Posted by Rachel UpsonJanuary 21, 2016dashboard, Merchandising, Reporting and Analytics, User Experience

devices_dashboard“Big data” is all the buzz. It’s a challenge to merchants and data providers alike. Complex calculations on large volumes of data can be fascinating to a programmer. But these aren’t just numbers – they represent real-life actions of people on a website. If we aren’t careful, our calculations can outsmart the spirit of these actions, resulting in meaningless (or at least misguided) data for merchandisers.

Recently we undertook a project to create a new dashboard for the SLI Merchandising and Reporting Console. With more than 100 metrics already available in our console, it would have been easy to present some of these and call it a day.

But we decided it was time for a fresh start. We talked to our customers about what was most important to them. Then we went further – all the way back to the basics. We examined our underlying calculations to ensure the way we tracked data considered customers on their shopping journey and not just purchases.

Many existing reporting systems, including our own, count events like transactions and compare them to other events like page or session counts. But tracking events in isolation doesn’t always reflect how shoppers behave. Consider a shopper who starts browsing in the early evening, breaks for dinner and returns to make a purchase after putting the kids to bed or the shopper who has a late-night browsing habit and completes her purchase after midnight. Many analytics simplify and examine activity based on a set time period. As a result, each of the previous examples would likely be considered as two sessions – one that failed to convert and one that succeeded – when in actuality each was a single shopper.

A session-focused versus shopper-focused model can cause e-commerce sites to worry needlessly about conversion rates when in actuality the trouble is with how their analytics views the data.

Another example of analytics skewing reality is when a customer completes a transaction and then realizes he forgot something and makes a second purchase. Should one customer be treated as two just because he completed a second transaction? When considering conversions, is a shopper who transacts twice buying one item each time really more valuable than the shopper buying two items in a single transaction? We don’t think so.

The new SLI Dashboard now includes shopper-focused attribution. As a result, SLI looks at all of a shopper’s activity in the 24 hours leading up to a transaction, regardless of when it occurred. A site visitor with activity before midnight that continues into the next day is counted once, and multiple conversions from a single customer are treated as one successful conversion.

Conversion rate and average order value are critical measures of your e-commerce site. You need them to be an accurate representation of how many people successfully found what they were looking for, how many items people bought and how much they spent. The new SLI Dashboard provides a real-life view of how your customers are interacting with your site. In a world of numbers and calculations, let’s remember our customers are people too.

Time to Rethink Holiday Promotions Timing

Posted by Eileen ElamJanuary 12, 2015eCommerce, Press, Reporting and Analytics, Site Search

When it comes to holiday shopping, peak shopping days and times are experiencing a dramatic shift that could impact the timing of critical promotions. Consumers are shopping on days that were previously considered taboo for this type of activity, such as Thanksgiving Day and Christmas Day. It’s time for retailers to take note to ensure they don’t miss big opportunities to reach their buyers when they are actually shopping.

boxing day image 1

In Australia, it is well known that Boxing Day (the day after Christmas) is the peak shopping day of the year. Yet, according to a new SLI study, many consumers are starting their shopping on Christmas Day. SLI researched e-commerce site activity across 100 Australian retailer sites, analyzing 20 million queries over the month of December. Online shopping activity peaked at 8:00 p.m. AEDT on Christmas Day and 10:00 a.m. on Boxing Day. While Boxing Day exhibited 49.6 percent more activity than Christmas Day, the spike in shopping activity on Christmas night is certainly a new trend worth exploring.

In the U.S., similar shifts in shopping behavior occurred. Most notable was a spike in shopping activity at 10:00 p.m. EST Thanksgiving Day, the night before the renowned Black Friday. There was also a spike in shopping activity on November 30, the night before the busiest U.S. online shopping day, Cyber Monday. To gather these results, SLI studied e-commerce site activity across 500 retailer websites in the U.S. (100 were Internet Retailer Top 1,000 retailers), analyzing 45 million queries during Thanksgiving week.

image peak US shopping hours 2

Consumers (increasingly online night owls) are beating retailers to the punch on unexpected days and times. By timing key promotions accordingly, savvy online retailers can take advantage of these new opportunities and have a jump on their competition in 2015.

How Site Search Helped One Company Launch a New Product Line

Posted by Kemberly GongFebruary 22, 2013eCommerce, Reporting and Analytics, Site Search

lovehoney - 50 shades

We talk a lot on this blog about how site search can help retailers improve conversions, merchandise products better and increase average order value. Some retailers have also launched new successful product lines using site search. Because of keywords that kept popping up, that were different from what visitors normally search for, our online retail client Lovehoney, based in the UK, was able to launch a new product line branded for the soon-to-be popular “Fifty Shakes of Grey” phenomenon – before anyone else knew it was a big deal.

Lovehoney, the UK’s largest retailer of adult toys, figured out that its customers were big fans of the 50 Shades of Grey book series, long before the books were heavily covered in the media. Matt Curry, the head of e-commerce for Lovehoney, and his colleagues, looked at keyword search data from Learning Search, and noticed that customers were searching for the name of the books as well as some of adult products mentioned within – terms they had never seen or heard of before.

Sensing demand for 50 Shades-themed products, Lovehoney quickly reached out to its buyers to stock up on relevant items, and also did a partnership deal with the books’ author to become the exclusive distributor for a line of 50 Shades of Grey merchandise. On top of that e-commerce breakthrough, Lovehoney is also reaping the benefits of Learning Search – the conversion rate for site search users is four times that of non-site search users, and average revenue per visit is 15% higher for site search users as well.

Lovehoney has a great story to tell about its ongoing success, and we’re happy to have played a part. You can listen to their recent webinar and hear more about how site search has helped their business grow.

Surprising Results from SLI’s eCommerce Survey

Posted by Terry CostaDecember 11, 2012eCommerce, Merchandising, Mobile/Tablets, Reporting and Analytics, SEO, Site Search, Social Media1 comment

SLI Systems just released our latest eCommerce survey and infographic, which illuminates new trends about online retailers’ priorities for the coming year, as well as for this holiday shopping season.

Overall, improving sales conversions was still the most important goal for online retailers, with 63 percent answering it was their main priority. Close behind with 61 percent was attracting more customers to the website. The survey of 457 retailers from around the world also found that expanding to serve international customers was another major priority. The surveyed included companies located in the US and Canada, UK, Europe, Australia/New Zealand and Asia/ Pacific.

In anticipation of this year’s holiday shopping season, more than 40 percent of online merchants worked to drive more customers to their site by making improvements to their SEO, and created a more curated experience for customers by improving their merchandising. Additionally, 37 percent of retailers improved their refinements or navigation on their eCommerce site, according to the results of our survey.

Additionally, retailers are planning out their strategies to grow their site in 2013. The top New Year’s resolutions include making improvements to site search, SEO and mobile. In line with this year’s solid increase in mobile browsing and purchases for holidays shopping, nearly half of retailers said they will add a mobile version of the website, with about 20 percent planning to create a mobile app.

As more commerce moves online, the trends for retailers – improving SEO, driving conversions and finding ways to reach customers at many touch-points continues to drive the need for higher visibility from SEO, thoughtful user experience and innovative features to improve traffic, conversions and retention. We’ll take a deeper look into all of these trending features in the coming weeks and explore the best use cases we’ve seen.

These are just a handful of the results – to learn even more, click here to download the full report.

Improved Usability & Merchandising Are Keys to Growing Mobile Commerce

Posted by Terry CostaOctober 9, 2012Conferences, Merchandising, Mobile/Tablets, Reporting and Analytics
It’s no surprise that the mobile commerce market is growing incredibly fast – and this year experts predict a lot more mobile purchases during the holiday season than we saw last year. According to studies by Forrester Research, mobile retail and travel spending will double in 2012 over 2011 — and they project the market size to quadruple by 2017, with retail being the fastest growing mobile segment. This research and the expectations for a big increase in mobile shopping activity validate the need for retailers to develop user-friendly mobile commerce sites.

With that in mind, we announced today several new enhancements to our SLI Mobile site search solution, including: mobile Auto Complete, QR code integration, mobile banners, analytics tracking and multivariate testing (see our press release for more details).The new features and capabilities are designed to give online retailers better merchandising and customization options while improving customer engagement and the overall mobile search experience. 

Many of these new features have been developed to accommodate the needs of our growing mobile customer base, which recognizes the need for good usability on the mobile platform, as well as the ability to merchandise, test, and track performance of various design elements. Many of our existing clients are turning to us for their mobile site search implementations, including Dooney & Bourke, 24-Hour Fitness, Cache, MakeMeHeal.com and U.S. Toy/Constructive Playthings, among many more – and they’re seeing strong results in terms of how people interact with their mobile site and how that translates to more purchases.

This week, we’re showing off these new features and talking about best practices for mobile search at Mobile Commerce Forum in San Diego. If you’re interested in going mobile or need guidance on how to take your mobile site to the next level, stop by and visit us in booth #305, and get a first-hand view of our solution and its benefits. If you’re not in San Diego, feel free to drop a comment here.

Site Search Performance is all in the Reporting

Posted by Terry CostaSeptember 26, 2012Mobile/Tablets, Reporting and Analytics

Do you monitor your site search reports on a regular basis to see how well your search is performing? If you aren’t, you’re missing out on valuable data that can be instrumental in ensuring relevance of results.

For example, perhaps there’s a keyword term that is used by lots of visitors but has a low click-through rate – meaning it generates poor results. Terms that deliver poor results are revealed in your site search reports, and once you identify them you can decide how to improve the results – either by incorporating the language of your visitors into product descriptions, or by configuring your search to account for synonyms, or perhaps adding additional items to your inventory.

Below are a few tips related to leveraging site search reports to improve your search performance, and ways to put the information you receive into action to enhance the overall experience. To see more, be sure to download our newest Big Book of Site Search Tips, a collection of 100+ actionable tips for giving your site search a boost.

1. Review search quality metrics — It’s important to review your site search quality metrics to ensure your search relevancy is improving over time. Some metrics you should track include average rank, click through rate, and revenue generated per person that searches. A good site search solution “learns” by tracking visitors’ search queries and click-throughs to deliver results based on criteria such as popularity. This means that searchers on your site are presented with the most relevant search results and can find what they’re looking for quickly and easily. Improved searches result in more satisfied customers and greater sales.

2. Review site search terms for SEO and PPC campaigns — Another best practice is to regularly review site search terms to improve your SEO and PPC campaigns. This is a great source for keyword research because the language your visitors use on your site search will be very similar to the language they use when searching the web for the same products or content.

3. Watch the keywords that are gaining popularity — Watch the keywords that are quickly gaining popularity so you’re able to continually meet increasing product demand. Again, it’s important to understand the language of your customers. Like any trend, nothing lasts forever, including the search terms used most frequently on your site. Trends around popular terms may shift with the seasons, or with popular songs and movies, or with the latest look sported by Justin Bieber. The point is, as terms gain popularity, they signal to you that the products that go along with those terms will likely also gain popularity. Be prepared for these shifts.

Analyze Site Search Data to Uncover Holiday Shopper Habits

Posted by geoffbDecember 10, 2009eCommerce, Reporting and Analytics1 comment

Imagine the holiday-shopping customers who show up at your website to buy piles of gifts, only to discover that your online storefront doesn’t have the red sweater/popular new toolset/cute baby toy they’ve been searching for. They’ll quickly leave your site, taking the potential sales with them – and you’ll never know they were there.

That is, you won’t know that they came to your site, searched, and left unless you scan your search data for clues to shoppers’ wants and needs. Your site search information contains a gold mine of information about holiday shoppers’ gift-buying habits, and a little sleuthing can help you determine which products to add or promote, and how to ensure that gift-givers find what they need on your site.

Look for products, or variations on products, that you don’t currently carry. Granted, given the demands of inventory and ordering, it may not be possible this late in the season to add to stock. However, you may discover that customers are searching for a product that you already carry, but in a different size or color – and it may be easy for you to simply order this variation from a supplier. Additionally, they may be using a search term you hadn’t thought of, so they may not be finding something that’s available on your site. Make sure your product descriptions match the search terms of your customers.

Look for spelling variations for products you already carry. If your customers spell it “ifone case” and what you sell is an “iPhone case,” their searches may not yield the desired products. You’ll find these common misspellings by checking your site search data. Make sure to optimize your site search so that misspelled queries still turn up the correct results. (And consider adding Auto Complete to your site search, which will suggest search terms as customers type – this is a big help for hard-to-spell items.)

Look for popular searches that may not result in high sales. If customers repeatedly search for certain items, but your sales figures don’t show a corresponding uptick in sales, you may need to promote these items more aggressively.

Improve SEO campaigns to bring shoppers to your site. Keyword research is critical to any SEO effort, and your customers’ search terms provide one of the best sources of SEO terms. Using data from site search can save time and provide additional targeted keywords – not merely educated guesses about what customers are searching for – in order to drive traffic to your site.

By taking a few minutes to analyze search data, you can uncover valuable information about holiday shoppers’ buying habits. If you have any questions about these tips, please email us at info@sli-systems.com.

Site search analytics course

Posted by Shaun RyanJanuary 24, 2008Analytics, eCommerce, Reporting and Analytics, Site Search, Site Search Tips

I spotted that Lou Rosenfeld is running a site search analytics seminar on March 18 in Sunnyvale. I’ve chatted to Lou about this topic before and he definitely seems to know what he’s talking about. I recommend taking a look at this course if you would like to delve deeper into this very valuable area.

Stay up to date with SLI

Featured Posts

  • Maximize Revenue with Enhanced Product Impact Testing
  • Top Five Ways to Prepare for Peak Season
  • Facets, Facets, Who’s Got the Facets?
  • Personalization: It’s Kind of a Big Deal
  • M is the New E: Mobile Commerce Trends and Predictions

Categories

About SLI Systems

  • What We Do
  • Who We Are
  • Why SLI

Learn

  • Webinars
  • News Room
  • Events

Connect

© Copyright SLI Systems, 2018. All Rights Reserved | US: (866) 240-2812 | Legal